The PREP Group Presents: Data Collection
As a part of a series for paraprofessionals, Drs. Miguel and Tomaino presented a 1-hour webinar on data collection. Here we will recap the basics of their webinar which covers everything from what data is, why we collect it, how to use it and how exactly it is measured for different situations.
Data is not about adding more to your plate. Data is about making sure you have the right things on your plate. -Principal Principles
Why do we need data? Data is the only way to determine baseline for anything. Taking data is also the only objective way to determine if a student is making progress. It is also an important piece of IEP planning and determining placement for a student. In order to know if an existing program is effective, or what additional resources may be necessary, we also need data to steer us in the right direction.
What exactly should we be measuring? It is always important to monitor skills being learned as well as behaviors impeding learning. Any behavior that contributes to a students educational program should be measured with data, both for skill acquisition and challenging behaviors.
Moving on to the way we take data, here are some common classroom measures used:
- Event Recording/Frequency: The count of behavior as it occurs. Dimension of measurement (count, e.g.: 5 times) — Example: The number of times a student hits When to use: When you know the topography, the behavior is a discrete response (clear start and finish), the behavior occurs for a short duration, appropriate with low and high frequency behaviors if other conditions are met.
- Rate: A ratio of the count (frequency) per observation time. Dimension of measurement (numerical ratio e.g.: 5 times per hour). Example: The number of times the student hit per class/hour/session. When to use: Best measure when the duration of observation varies. Minimum day versus regular day, Pull out versus push in service times.
- Latency: The time from the presentation of the stimulus/instruction to the occurrence of the behavior. Dimensions of measurement: Temporal (e.g.: 7 minutes, 2 seconds). Example: The direction is given to touch head, 10 seconds later the student touches head. Latency is 10 seconds. When to use: When you need to record the time it takes for the response to occur, following instruction, compliance, processing delays.
- Duration: The length of time a behavior occurs. Dimension of measurement: Temporal (e.g.: 7 minutes, 2.4 hours) Example: A student engaging in outburst behavior for 37 minutes. Frequency 1, duration: 37 minutes. When to use: When the behavior is not a discrete response, need time of one occurrence (outburst), total time of multiple occurrences (time out of class).
- Percent Opportunity/Trial Based: Number of correct responses out of a total number of trials or opportunities. Example: Percent correct on a spelling test, percent of presented opportunities that the student raised their hand. When to use: Skill acquisition, when you want to measure what the student is able to do, great for IEP goals targeting skill building or learning.
-
-
- Onset/Offset: Onset is when the first sign of the behavior is demonstrated (student raises hand to hit you prior to eloping). Offset is when the entire behavior topography is absent for a specific duration (the student has returned to his desk and is complying for 2 minutes). Use when collecting data on target behaviors. Most important for behaviors without a clear start and finish. Onset and offset are important for accuracy of data. Also, it assist in maintaining accuracy across team members. Onset and offset also help to determine what constitutes a behavior and gives the team the ability to compare data across days and times. *Topographies, onset and offset should be determined by your teacher/BCBA/etc.
- Response Types: Independent/Correct, Prompted, Incorrect. Only independent/correct trials should be counted as a plus (+). You find your percentage by dividing the number of correct by the number of trials/opportunities. Example: 8 correct out of 10 trials= 80%.
-
-
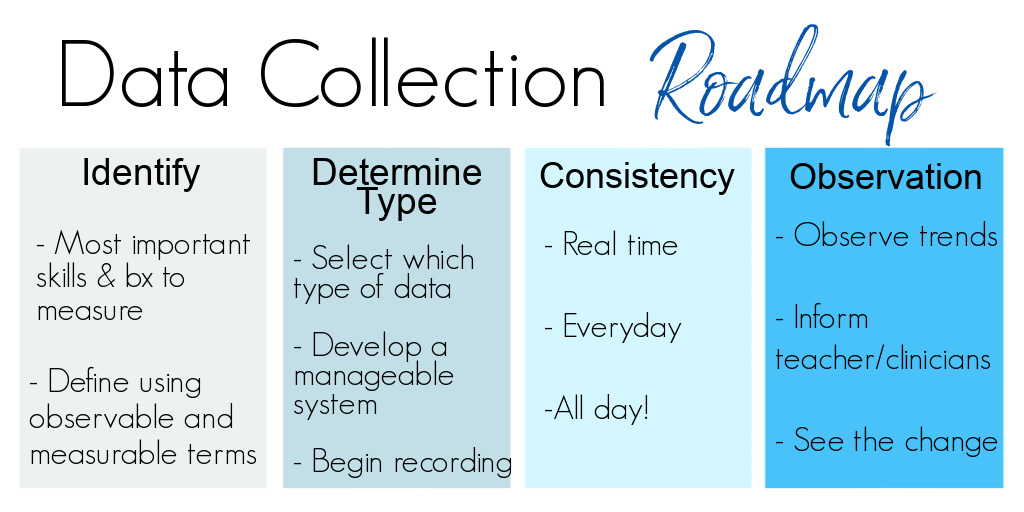
In conclusion, in order to obtain the most accurate data to aide your student and assist in their progress, your teacher or BCBA should determine the behaviors to target, select the data collection method best for each behavior, develop a data sheet and the entire team should take data consistently. After some time you and the team can analyze the data and make a data informed decision on the plan.
For any questions or further assistance in developing a data collection data sheet or behavior plan, email Drs. Miguel and Tomaino. emiguel@portviewpreparatory.com mtomaino@portviewpreparatory.com